March 8, 2023
Considerations for Global Investing
Tom O'Shea, CFA
Director of Investment Strategy
Innovator Capital Management
Over the last decade, global investing has fallen out of favor. U.S. investors with home country bias have been rewarded as the S&P 500 outperformed the MSCI EAFE Index and the MSCI Emerging Markets Index by a large margin. Historically though, this has not always been the case. As an example, investors allocating only domestically during the lost decade, from 1999 to 2009, would have experienced portfolios losses. During this same period, diversifying with a 15% allocation to developed ex-US and 10% in emerging markets, would have led to small gains. Should investors that invested only in the U.S. consider re-entering international equities? Right now, we believe there is a strong case for global diversification.
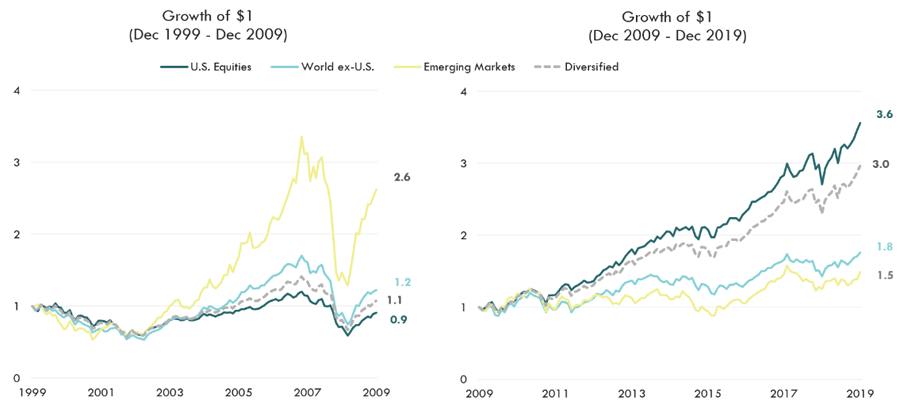
Source: Bloomberg L.P., Innovator Research & Investment Strategy. Growth of $1 shows the cumulative return for equity regions which are proxied by the S&P 500, MSCI World ex-U.S. Index, and MSCI Emerging Market indices. A diversified portfolio is 75% S&P 500, 15% MSCI EAFE, 10% MSCI Emerging Markets. Past Performance does not guarantee future results. You cannot invest directly in an index.
Why Emerging Markets?
China’s Zero Covid Policy and strict regulations on technology companies made investing in emerging markets undesirable in 2022. The Fed acted as an additional headwind as monetary tightening significantly strengthened the U.S. dollar. As a result, foreign investors’ export prices increased and financing costs associated with dollar-denominated debt rose. Many factors contribute to emerging market equity prices, but the U.S. dollar is a major driver that has historically explained over 40% of the variability in 5-year equity returns.
Although we expect Fed officials to tighten the policy rate further, the slower pace of hikes means dollar strength may have peaked. Falling dollar strength combined with loosening regulations and consumers in China ready to spend their lockdown savings can accelerate economic growth in the short to intermediate term. The growth potential and below median valuations make strong arguments for an allocation to emerging markets in investor portfolios.
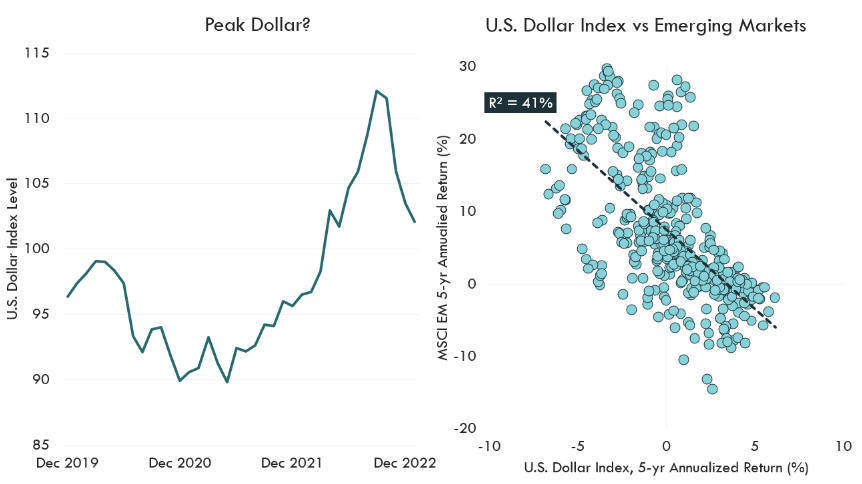
Source: Bloomberg L.P., Innovator Research & Investment Strategy. Left Panel: U.S. dollar index from 12/31/2019 - 1/31/2023. Right Panel: 5-year annualized returns of U.S. dollar index and MSCI Emerging Markets Total Return USD Index from 12/31/1987 -1/31/2023. Past performance does not guarantee future results.
R2 is a statistical measure in linear regression the calculates how much of the variability of the independent variable (MSCI EM 5-year annualized returns) is explained by the changes in the dependent variable (U.S. Dollar Index, 5-year annualized returns).
Why Developed ex-U.S.?
As winter approached in 2022, economists forecasted a recession in Europe due to elevated gas prices and projected harsh weather conditions. Europeans were surprised with a milder winter and falling oil prices, providing much needed relief. The low-growth environment failed to materialize, but valuations are still well below long-term medians. With the worst-case scenario unlikely to occur, current valuations may be an attractive entry point in Europe.
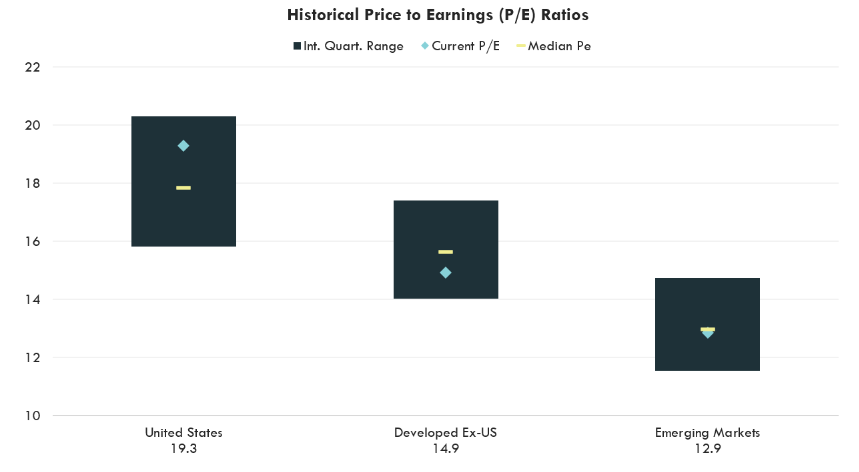
Source: Bloomberg L.P., Innovator Research and Investment Strategy. The regions are proxied by the S&P 500 index, MSCI EAFE index, and MSCI Emerging Markets Index. Price to earnings interquartile ranges are calculated on monthly data from 4/30/2006 - 1/31/2023. Current P/E ratios as of 1/31/2023.
Current P/E values reflected in the x-axis. Median P/E of ranges in order of chart appearance: 17.8, 15.7, 13.0. Interquartile ranges 15.8 -20.2, 14.0 – 17.4, 11.6 – 14.7.
Earnings Growth Picture
Financial markets are forward-looking in nature. Reviewing the earning expectations in the 2010s, investors consistently believed U.S. earnings would outpace their international counterparts. These earning expectations were consistent with the performance of each equity region over the time period. China’s pro-growth measures, like ending the lockdown, have been reflected in recent strong Purchasing Managers’ Index (PMI) readings. As a result, forward earnings have been trending higher. Europe’s forward earnings are also trending positive. For investors still uncertain about the prospect of future performance outside the U.S., additional risk measures can be taken to help hedge against negative returns.
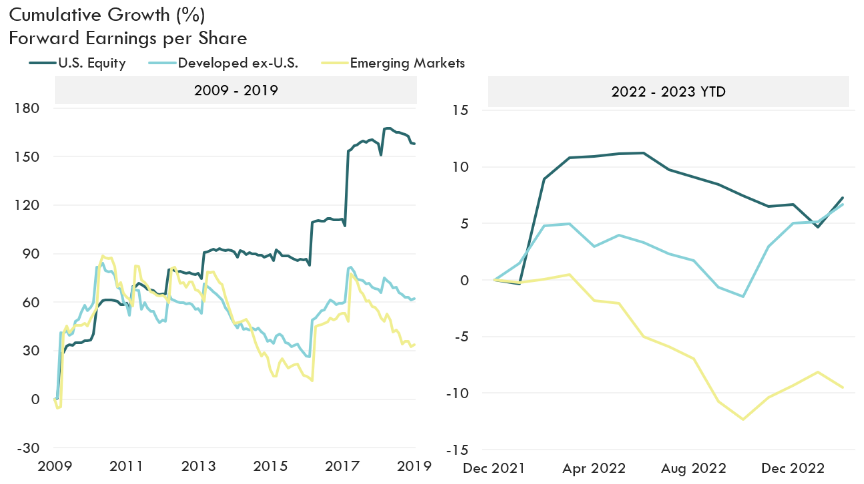
Source: Bloomberg L.P., Innovator Research & Investment Strategy. U.S. Equity proxied by the S&P 500; Develop ex-U.S. proxied by MSCI EAFE, Emerging Markets proxied by MSCI Emerging Markets. Left: Monthly data from 12/31/2009 - 12/31/2019. Right: Monthly data from 12/31/2021 - 2/28/2023.
International Exposure with Risk Mitigation
Few investors are agile enough to shift into the most favorable equity markets. Greater historical volatility outside the U.S. may make some investors hesitant to include international equities in their portfolios, even though historical allocations have provided a measure of diversification. An international emerging and international developed market 15% Buffer strategy may give investors a greater level of confidence to re-enter these unloved markets. The following charts show the IJAN and EJAN Buffered International and Emerging Market ETFs relative to their reference assets since inception.
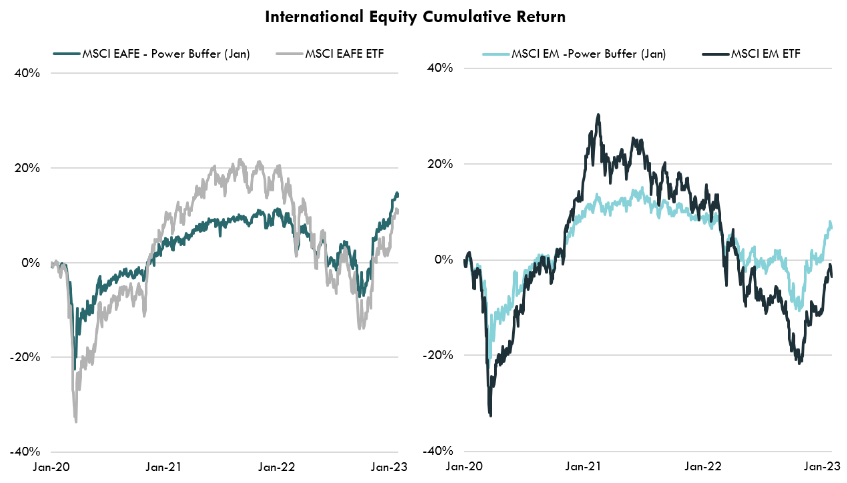
Source: Bloomberg L.P., Innovator Research & Investment Strategy. Daily data from 1/1/2020 - 1/31/2023. MSCI EAFE - Power Buffer (Jan): Innovator EAFE 15% Power Buffer (IJAN), MSCI EAFE ETF: iShares MSCI EAFE ETF (EFA), MSCI EM - Power Buffer (Jan): Innovator Emerging Markets 15% Power Buffer (EJAN), MSCI EM ETF: iShares MSCI Emerging Market ETF (EEM).
Performance quoted represents past performance, which is no guarantee of future results. Investment returns and principal value will fluctuate, so you may have a gain or loss when shares are sold. Current performance may be higher or lower than that quoted. Visit www.innovatoretfs.com/performance for current month-end performance.
Bottom Line
A portfolio with too little geographical diversification can hinder long-term growth and increase risk. Buffered international strategies may make the diversification process easier; they seek a 15% downside buffer over a one-year outcome period that can make them an attractive investment.
Standardized Performance
| | YTD | 1 Year | 3 Year | 5 Year | Inception |
| EJAN NAV | -8.31% | -8.31% | 0.47% | - | 0.47% |
| ETF Closing Price | -8.01% | -8.01% | 0.51% | - | 0.51% |
| MSCI Emerging Markets (PR) Index | -22.37% | -22.37% | -4.98% | - | -4.98% |
| IJAN NAV | 3.65% | 5.35% | 5.87% | - | 3.96% |
| IJAN Closing Price | 4.04% | 5.46% | 6.31% | - | 4.15% |
| MSCI EAFE (PR) Index | 5.65% | -5.76% | 4.31% | - | 0.26% |
As of 12/31/2023. EJAN's expense ratio is 0.89%; IJAN's expense ratio is 0.85%. EJAN and IJAN incepted 12/31/2019. Performance quoted represents past performance, which is no guarantee of future results. Investment returns and principal value will fluctuate, so you may have a gain or loss when shares are sold. Current performance may be higher or lower than that quoted. Visit Innovatoretfs.com for current month-end performance.
Shares are bought and sold at market price, not net asset value (NAV), and are not individually redeemable from the fund. NAV represents the value of each share's portion of the fund's underlying assets and cash at the end of the trading day. Market price returns reflect the midpoint of the bid/ask spread as of the close of trading on the exchange where fund shares are listed.
IJAN, the Innovator International Developed Power Buffer ETF™ - January, seeks to track the return of the iShares MSCI EAFE ETF (EFA), up to a predetermined cap, while buffering investors against the first 15% of losses over the outcome period.
EJAN, the Innovator Emerging Markets Power Buffer ETF™ - January, seeks to track the return of the iShares MSCI EM ETF (EEM), up to a predetermined cap, while buffering investors against the first 15% of losses over the outcome period.
The price to earnings ratio (P/E ratio) is the ratio for valuing a company that measures its current share price relative to its earnings per share.
Forward earnings per share are estimates of future earnings, and can be used to represent the market's optimism for a company's prospective growth.
The MXEA Index is composed of large and mid-cap companies from 21 developed countries excluding US and Canada.
The MXEF Index is composed of large and mid-cap companies from 24 emerging markets countries.
The funds only seek to provide their investment objective, which is not guaranteed, over the course of an entire outcome period. Investors who purchase shares after or sell shares before the end of an outcome period will experience very different outcomes than the funds seek to provide.
The Funds have characteristics unlike many other traditional investment products and may not be suitable for all investors. For more information regarding whether an investment in the Fund is right for you, please see "Investor Suitability" in the prospectus.
The ETFs can be held indefinitely, resetting at the end of each outcome period. There is no guarantee the funds' will achieve their investment objective.
The Funds face numerous market trading risks, including active markets risk, authorized participation concentration risk, buffered loss risk, cap change risk, capped upside return risk, correlation risk, liquidity risk, management risk, market maker risk, market risk, non-diversification risk, operation risk, options risk, trading issues risk, upside participation risk and valuation risk. For a detail list of fund risks see the prospectus.
FLEX Options Risk The Fund will utilize FLEX Options issued and guaranteed for settlement by the Options Clearing Corporation (OCC). In the unlikely event that the OCC becomes insolvent or is otherwise unable to meet its settlement obligations, the Fund could suffer significant losses. Additionally, FLEX Options may be less liquid than standard options. In a less liquid market for the FLEX Options, the Fund may have difficulty closing out certain FLEX Options positions at desired times and prices. The values of FLEX Options do not increase or decrease at the same rate as the reference asset and may vary due to factors other than the price of reference asset.
These Funds are designed to provide point-to-point exposure to the price return of the Reference Asset via a basket of Flex Options. As a result, the ETFs are not expected to move directly in line with the Reference Asset during the interim period.
Investors purchasing shares after an outcome period has begun may experience very different results than funds' investment objective. Initial outcome periods are approximately 1-year beginning on the funds' inception date. Following the initial outcome period, each subsequent outcome period will begin on the first day of the month the fund was incepted. After the conclusion of an outcome period, another will begin.
EJAN & IJAN: Non-U.S. securities and Emerging Markets are subject to higher volatility than securities of domestic issuers due to possible adverse political, social or economic developments, restrictions on foreign investment or exchange of securities, lack of liquidity, currency exchange rates, excessive taxation, government seizure of assets, different legal or accounting standards, and less government supervision and regulation of securities exchanges in foreign countries.
Fund shareholders are subject to an upside return cap (the "Cap") that represents the maximum percentage return an investor can achieve from an investment in the funds' for the Outcome Period, before fees and expenses. If the Outcome Period has begun and the Fund has increased in value to a level near to the Cap, an investor purchasing at that price has little or no ability to achieve gains but remains vulnerable to downside risks. Additionally, the Cap may rise or fall from one Outcome Period to the next. The Cap, and the Fund's position relative to it, should be considered before investing in the Fund. The Funds' website, www.innovatoretfs.com, provides important Fund information as well information relating to the potential outcomes of an investment in a Fund on a daily basis.
The Fund only seek to provide shareholders that hold shares for the entire Outcome Period with their respective buffer level against reference asset losses during the Outcome Period. You will bear all reference asset losses exceeding the buffer. Depending upon market conditions at the time of purchase, a shareholder that purchases shares after the Outcome Period has begun may also lose their entire investment. For instance, if the Outcome Period has begun and the Fund has decreased in value beyond the pre-determined buffer, an investor purchasing shares at that price may not benefit from the buffer. Similarly, if the Outcome Period has begun and the Fund has increased in value, an investor purchasing shares at that price may not benefit from the buffer until the Fund's value has decreased to its value at the commencement of the Outcome Period.